You are on the Home/This Web site page
Google
Web This Site

Website statistics

Site Map

Website Statistics

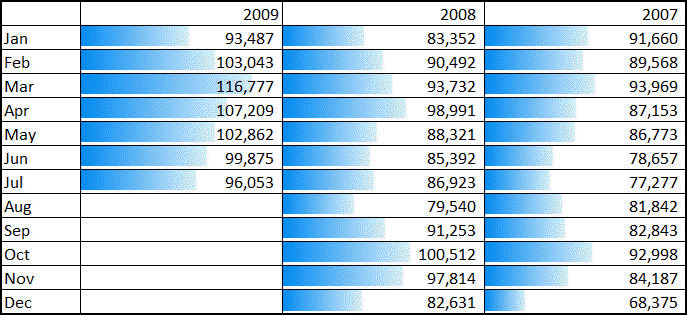
Since I first started publishing on the web in 1999, two major redesigns of the site have sharply improved accessibility.  The vast majority of visitors find what they are looking for without having to wade through introductory pages.  Even with the reduced navigation requirements, the first 6 months of 2009 saw a 15% increase over the comparable period in 2008 and for the entire year 2008 saw a 6% increase in the million+ pages visited through the year.


Visitors' comments about this site

If you haven't already done so, please read the disclaimer.

If you have any comments, suggestions, criticism about the site, please contact me.

Site Map

Below is a complete map of the site (well, at least the pages that are ready for public consumption)

Navigation
Home -- TM Consulting
  Consulting Services
    Operations Strategy
    Management Simulations
    Excel Services
    Ad hoc Technical Services
  Search multiple web resources
    Web Search
    Product Search
    Retail Search
  Publications & Training
    Business Data Management
      Names and formatted formulas
      Designing an Analysis Template
    Case Studies
      Create a Self-Adjusting Range
      Top 10 with consolidation
      The Excel IF function
      Dynamic Text in a Shape
      Banded Rows
      Conditional Color of Shapes
      Harvey Balls
      Generate All Permutations
      Array formulas
      Property procedures in a standard module
      Range To-From Array
      Array COUNTIF
      Multiple event tasks
      Application.Run and ByRef Arguments
      Message for a Duration
      Index into a multi-area range
      Greeting Wave
      Direction Icons
      Data Analysis
      VBA web services
      Excel and Google Charts
      LINQ to find and open a file
      Process folder files
      Sequence of VBA Events
      Periodic Task Each Day
      Application.Run and ByRef Arguments
      Worksheet to HTML
    VBA book (draft)
      Recursion
      Power of Variants
      Userform interface
  Excel
    Software
      TM AutoChart
        TM AutoChart add-in help
      TM Calculator
        TM Calculator Help
      TM Calendar
      Chart gap for N/A
      Chart Image to Data
      TM Chart Leader Lines
        TM Chart Leader Lines Help
      TM Chart Utilities
        TM Chart Utilities Help
      Clocks
        Floating clock
        Countdown Timer
      Custom Radar Chart
      Data Form
      Directory List
        Directory Listing Help
      Gantt (Project) chart
        Gantt functions
      Hover Chart Label
      Interactive Chart
      PivotChart Drilldown
      TM PivotTable
      TM Plot
        TM Plot Manager Help
      SIMULATE
      Solve Polynomials
        Polynomials Help
      Table of Contents
      Text Write
      TM Tornado
        TM Tornado Help
      Floating Browser
      Excel Utilities
        Workbook Navigator
        Graphing Calculator
        Enhanced Find
    Templates
      Calendar template
      Compare TVs and monitors
      Solver to match set elements
    Charts
      3D Surface
      Normal curve
      Step chart
      Straight lines
      Supply & Demand
      Demand Elasticity
      Waterfall chart
      Conditional shape colors
      Graphically displaying numbers that differ by a magnitude
      Case Study – Single Chart Dual Axis
    Tutorials
      Broken y axis
        Broken axis tutorial
      Cascading queries
        Moving the database
      Color zone in X-Y chart
        Color Zone Tutorial
      Chart Custom Formats
      Custom Chart Table
      Clickable Image
      Dynamic Charts
        Named Formulas
        Names in Charts
        Drop Down Box
      Dynamic Chart Title
      Data Labels
      Format formulas
      Flexible Log Scale
      Floating Bars
        Floating bars tutorial
      Frequency Table
      Interpolation
      Numerical Integration
      Random Selection
      Ranking
      RDBMS in Excel
        Introduction
        Query Results
        Build Queries
          Query 1
          Query 2
          Query 3
          Query 4
          Query 5
      Select Markers
      Shaded Band
      Stacked Charts
      Worksheet as Chart
      Worksheet as Gantt Chart
      Unusual interfaces I
      Validate Data I
    Excel Tips
      Enter time with seconds
      Read Chart Value
      Multi Area Argument
      Data in blocks
      Random password
      Find All
      Power Set
      Regression Analysis
      Factors and prime numbers
      Hyperlinks
      Delimited Numbers
      Progress bar
    VBA
      Downloads
      Beyond Excel's recorder
      Program won't quit
      Understand code
      Case Study – Embedded or Linked objects
      Objects and arguments
      Monitor Events
      Case Study – Defensive Programming
      VBA and Multiple Sheets
      VBA - Run and ByRef arguments
      Effective use of mnemonics
      Decode Mnemonics
      Simple Encoding
      Static Random Values
      VBA Timer
      VBA Calendar
    Time Zone Conversion
    Office 2000 shortcuts
      Shortcuts list (static)
      Shortcut list (interactive)
  PowerPoint
    Auto Schedule
    Random Slide Show
    Slide Show Timer
    Textbox from file
    Interactive PivotTables
    Time in Break
  Other Tutorials
    Outlook Express & Newsgroups
    Financial Calculator
  This web site
    Visitor Comments
    Contact
    About Me
    Disclaimer