Excel can easily add a variety of trendlines to data plotted on a chart. It can also join all the points in a series with a smooth line. However, there is no default way to read the x and y values corresponding to an arbitrary point on such a line.
This tutorial will show you how to do just that -- and very easily, too!
This feature does not apply to Excel 2007 or later because Microsoft removed the capability documented in this article. It did introduce a workaround that includes an add-in. For more see Excel Add-In for Manipulating Points on Charts (MPOC) with a caveat: please do not interpret my sharing this link as an automatic endorsement of the add-in or the workaround. You should evaluate it for your own requirements.
Matic on Jan. 3, 2013:
Great tip! Thank you!
| Suppose we have the chart on the right.
The markers in blue are the result of a simulation. They
represent the estimated profit from a new product over a period
of years after initial product introduction. The
polynomial trendline, together with its equation and the R2
value are shown in black. How does one find the value at any point on the trendline? Of course, the exact same technique discussed in this tip applies to any other types of lines such as the line connecting markers, be they the smoothed variety or just straight line segments. |
|
A little known feature of Excel is that the link between a point on a chart and the value in the cell is a two-way connection. Most of us know that changing the value of a cell will move the point within the chart. But, what is less commonly known is that the value in the cell can be updated by moving the point in the chart! For a XY Scatter plot, the plotted point can be moved in either the X or the Y direction. For other kinds of charts, the movement will be restricted to the Y value only.
| For example, in the video on the right,
the initial coordinate of the graphed point is (1,2). By
clicking on the point and dragging it down, one can change the
coordinate to, say, (1,1). [To start the video click the picture on the right.] |
|
| Now,
that we know how to move a point
graphically, we will use this technique to
find the coordinate of any point on the
actual line of interest. In the graph,
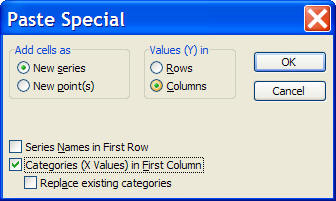
we will add a new dummy series consisting of
a single point as shown on the right. Enter two numbers (these will be the x and y coordinates of the point) in some cells (C7:D7 in the example at the right). Select the two cells, click-and-drag to the graph. Excel will show the Paste Special dialog box. Select the options as shown in Figure 3. The result is shown in Figure 4. Now, select the point on the graph and move it as desired. Then, simply read the value of the coordinates from the cells C7:D7 (or hover the mouse over the point and Excel will show the coordinates in a tooltip box. The video on the right shows how to read the value of the trendline at x=3.5. Since the x axis is years and the y axis is profit, this will show the estimated profit at the 3-1/2 year mark. [To start the video click the picture labeled Figure 4.]
|
|