To skip the documentation and immediately download the add-in:
Download the the zip version.
|
|
This add-in implements an interactive graph creator and analyzer. It lets one visually examine how various cells affect an Excel formula. Since it uses the contents of one or more Excel cells, the program is not limited to plotting graphs with known equations but the content of anything that can be put in an Excel cell!
 |
The values in the cells that affect the plotted cells can be changed through the controls on the userform, which, of course, is customized to the graph currently being analyzed.
Installation
Start by downloading the zip version. Unzip the add-in file to a directory of your choice.
In Excel, use Tools | Add-Ins... to load the add-in. Depending on where you installed the file in the above step, you may have to click the Browse... button and locate the file.
Make sure that your security setting allows the loading of the add-in. For versions of Excel after 2000, the easiest way to load the add-in is to ensure your security is set (temporarily, if you otherwise prefer another setting) to Medium. When Excel warns you about opening a file containing macros, you must select the 'Enable Macros' option.
Once loaded you should see the TM menu item on the main menu bar.
Using the add-in
Access the dialog box with TM | Charts > Interactive graph analyzer...
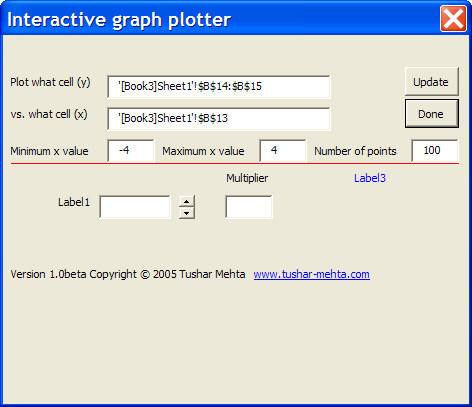
The top part of the user form defines what is analyzed. Based on what is specified, the lower portion of the user form will have custom controls for the current graph. If the five fields in the top part of the user form are locked, click the Change button. This will unlock them and convert the Change button into the Update button.
 |
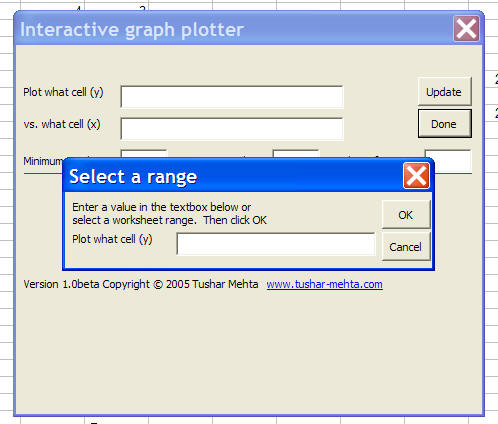
Note that the software uses a different type of technique than most of us might be familiar with to select worksheet cells. This is because the existing Excel and VBA capabilities don't support cell selections from what is known as a modeless user form. When you click in any of the five cells, a 2nd dialog box will pop up (see Figure 3). Once you have selected the cells of interest, click the OK button in this new dialog box. It will use your selection to enter the range into the field in the original dialog box. You can also type in the desired information: a range address when specifying the x or y cells, or a number when specifying the minimum x-value, maximum x-value, and the number of data points to be used for the analysis.
|
|
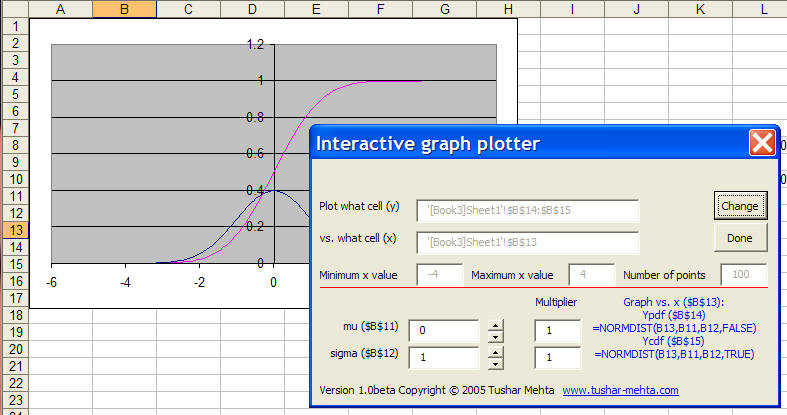
Once all the necessary information is available, click the Update button. This will result in the software drawing a XY Scatter chart for the x and y ranges you specified and displaying a revised userform as shown in Figure 4. Now, the lower part of the form becomes relevant. It contains one row for each cell that affects the value in the plotted cell(s). If the cells are named, those names are shown (see the references to mu, sigma, Ypdf, and Ycdf in Figure 4). The userform also shows what the chart contains (right bottom portion in blue). This indicates what the x-axis represents and that cells are shown on the y-axis.
The left half of the lower portion of the form is meant for the graphical analysis. Each row represents one cell that directly or indirectly affects the y-axis variables. The first textbox allows you to directly enter a new value for that variable. Alternatively, the spin buttons can be used to increase or decrease the value. Each click of the spin button increases or decreases the value by the multiplier amount. The default value of the multiplier is 1 and it can be set to a smaller value (say 0.1 or 0.01) for finer control of the analysis. As the values are changed, the impact on the chart is shown immediately
Once done, click the Done button. All the changes made by the add-in to the workbook will be removed.
|
Technical notes
The add-in plots the functions f(ai;x), g(aj,x) and visually displays the effect of changes to the ais.
The add-in also demonstrates an alternative approach to implementing a RefEdit type control in a modeless userform. Given that Microsoft has made no improvements in the RefEdit control since...well, since whenever, this is a functional alternative to the RefEdit control. Note that the control doesn't work unless directly embedded in a userform displayed modal. While not as elegant as the RefEdit, it addresses the need for a way to select an Excel range that works in a frame, a tab strip, a page component, a COM add-in, a userform shown modeless, or a .Net based form.
Other keywords
Charting Calculator Graphical Calculator function analyzer chart sensitivity analysis parameter analysis
Version Information
| Version | Description |
| 1.0beta | First implementation |
The author's email address is tushar@tushar-mehta.com and the web site is www.tushar-mehta.com.