Purpose of the AutoChart add-in
Installing the AutoChart add-in
About the add-in and to register it
One of the limitations of Excel's charts is the inability to link worksheet cells to parameters that govern how a chart axis is shown. For example, the minimum and maximum values for an axis can either be set to 'automatic' (meaning that Excel will decide what the values should be) or can be specified as a number. However, there is no way to tell Excel that it should use the contents of a particular cell. This add-in enables that capability.
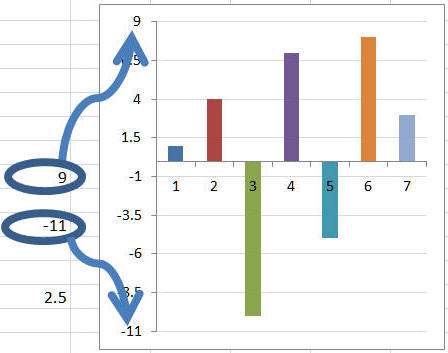
Figure 1
In addition, the add-in saves the automation information in the workbook in the form of hidden names. Consequently, the links need to be specified only once. After that, each time that workbook is opened, the links will be reestablished (as long as the add-in is loaded).
The add-in figures out for itself what kind of chart it is dealing with. It uses this information to selectively enable only those fields that correspond to axes that can contain customizable parameters. For example, only if the chart has a secondary axis that can contain numeric parameter values such as minimum, maximum, and major and minor ranges will the corresponding dialog box fields be enabled.
Note that the self-installer version also installs an uninstall capability. To uninstall select scroll down to the entry.
If you chose to download the zip version, unzip the add-in file to a directory of your choice.
For installation instructions see common installation instructions. In Excel 2003 load the add-in. In Excel 2007, load the add-in.
To use this add-in:
1) enter the maximum and minimum values (and major and minor ranges, if desired) for the various axes into worksheet cells. Each of these cells can have a number that has been typed in, or a formula that yields a number
2) Select a chart. The chart can be a sheet by itself (i.e., a chart sheet) or embedded in a worksheet.
3) Select the AutoChart button:
In Excel 2007 or later in the contextual ribbonselect thetabgroupbutton.
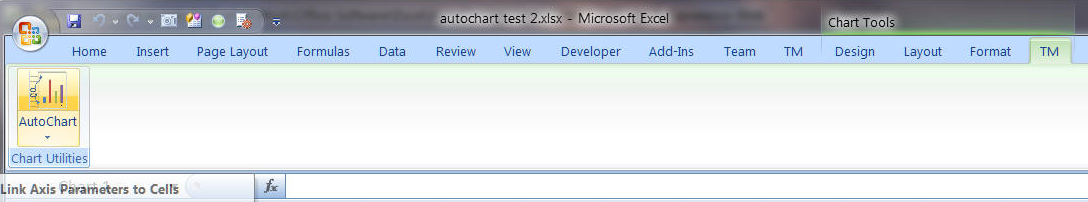
Figure 2
In Excel 2003 or earlier, select select
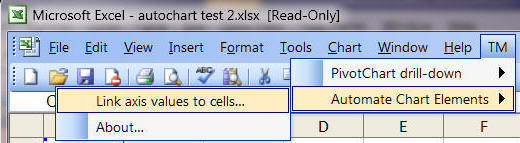
Figure 3
4) This will bring up the AutoChart dialog box (Figure 4). Only the boxes that correspond to numeric axis elements will be enabled. In those boxes, specify the linked cell for that axis element. The cells can contain either a number or a formula that yields a number. For example, D11 in the below example contains =MIN(A:A)-1, D9 contains =MAX(A:A)+1 and D14 the formula =(D9-D11)/(COUNT(A:A)+1)
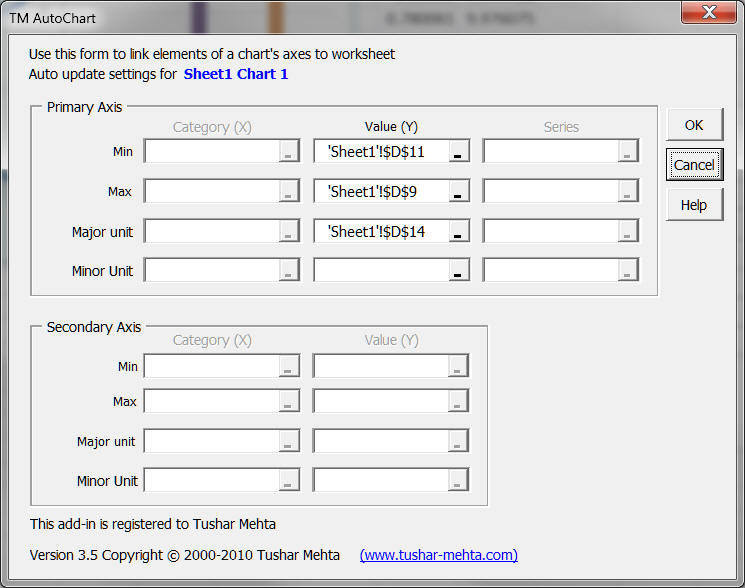
Figure 4
To stop the automatic updating of the chart, go through the steps required to automate the process but this time clear out all cell references. Clicking OK will cause the add-in to stop updating the selected chart.
To continue using the add-in after the trial period, please register it. See the About... and Register... buttons as shown in Figure 5.
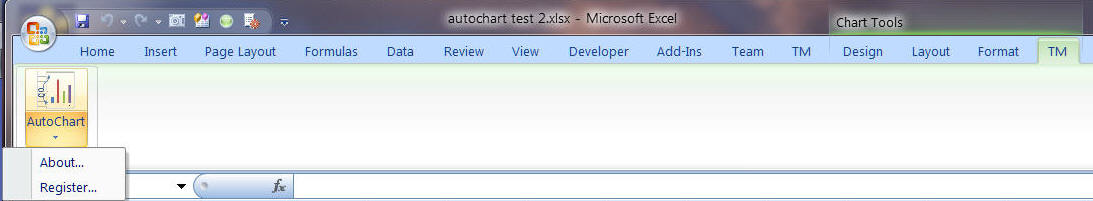
Figure 5
When necessary, the add-in changes the parameters associated with the axes of the chart being automated. When changes are made, the ability to undo the last change is lost. This is an intrinsic feature of Excel and there is not much one can do about it.

