This Excel add-in shows the Y or X value associated with the corresponding X or Y value for any XY Scatter chart.
Version 1.1m now works with XL97!
As Figure 1 shows, specifying the X (or Y) value in the dialog box shows the corresponding Y (or X) value both in the dialog box and on the chart itself. The values are shown both in their raw (user entered or computed) form and in the format of the appropriate chart axis.
If the chart has multiple XY Scatter charts, select the series of interest with the drop down box on the right side of the dialog box.
If used with a combination chart, especially with secondary (Y or X or both) axis, the graphical display may be confusing and/or unreliable.
The add-in uses piecewise linear interpolation to calculate the value of interest. If it encounters an error, the error description is shown instead of the numerical result.
The add-in adds two series to show the graphical results as shown in the blue and brown dotted lines in Figure 1. Closing the dialog box deletes both the extra series.
There is no additional help available for this add-in.
Figure 1
To install it, and for installation troubleshooting see this guide. Once installed, when a chart is selected, you will see a TM menu. Select it to see, and select, the Interactive Chart Display... menu item (see Figure 2).
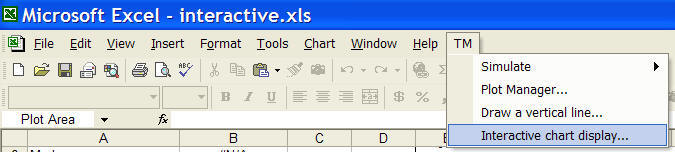
Figure 2

