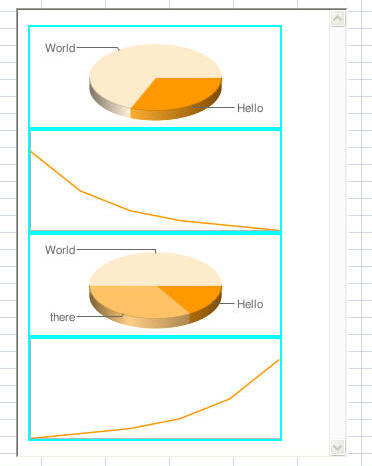
Excel by itself supports a range of charting options. Nonetheless, there are some things it doesn't do well. One of them is creating dashboard charts such as the one shown below. Google introduced a Chart API that is designed for charts on web pages. By combining a set of capabilities that link data in a Excel worksheet with a Google chart, it becomes possible to create charts in Excel that otherwise would be difficult if not impossible.
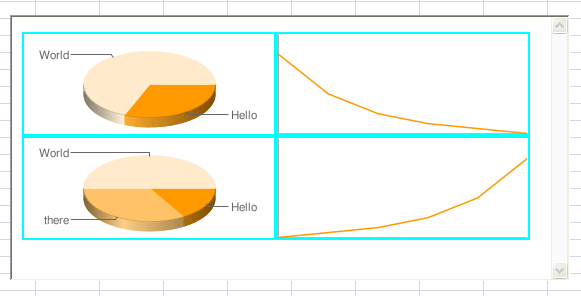
With the correct configuration of the HTML elements containing the charts, one can easily change the above 2x2 layout to 4x1.
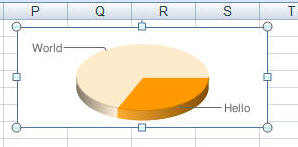 One
of the other interesting things one can do is to click-and-drag one
of the charts from the web browser window to the Excel worksheet.
This creates a static image of the chart.
One
of the other interesting things one can do is to click-and-drag one
of the charts from the web browser window to the Excel worksheet.
This creates a static image of the chart.
The Google documentation for the Chart API is at http://code.google.com/apis/chart/
This document contains code samples that are closer to "proof of concept" quality. Consequently, the reader should exercise appropriate judgment in using them.
The key to inserting a Google chart into a Excel document is to use the WebBrowser ActiveX control. Inserting the appropriate HTML elements in the browser document leads to multiple charts in the same browser window.
The rest of this document is organized as follows:
Inserting charts in the web browser
Responding to events in the browser
The connection between an Excel worksheet and a Internet browser window is through the WebBrowser ActiveX control. The WebBrowser control acts both as a container for a HTML document as well as a conduit for VBA to access it. Through the Document Object Model (DOM) VBA procedures have access to the elements in the HTML document.
The charting code initializes the HTML document with a single DIV element with the ID of AllCharts. Then, each chart added is inside a new child DIV element of the AllCharts element. The ID of this new DIV element is simply a unique number. Also, each DIV element "floats." This means that as the web browser window is resized, the charts will automatically "flow" within the window.
Finally, each individual DIV is declared in VBA as a 'with events' object. This allows the VBA code to respond to various chart specific events such as a user double-click. One could use this to reconfigure an existing chart.
While not part of this document, one could also use a worksheet Change event (or maybe even the Calculate event) to check if a chart created from a worksheet range requires revision.
The prerequisites for this document is a basic understanding of VBA programming, a basic knowledge of event driven programming, and a rudimentary knowledge of the structure of a HTML document.
Pre-requisite reference: The VBA project must contain a reference (Tools | References...) to the Microsoft HTML Object Library.
Initial setup involves inserting the web browser into the Excel worksheet and writing the routines that map Excel data into the chart codes that the Google Chart API uses.
The code below adds, if necessary, a web browser into the worksheet. It then navigates to some URL. For reasons I don't understand, this initial navigation is crucial to making the charts work in the web browser. In the example, the URL is a Google Chart URL itself.
Sub addBrowser()
    'Application.CommandBars("Control Toolbox").Visible = True
    Dim anOLEObj As OLEObject, BrowserPresent As Boolean
    For Each anOLEObj In ActiveSheet.OLEObjects
        BrowserPresent = BrowserPresent Or TypeName(anOLEObj.Object) = "WebBrowser"
        Next anOLEObj
    If Not BrowserPresent Then
        Set anOLEObj = ActiveSheet.OLEObjects.Add(ClassType:="Shell.Explorer.2", Link:=False, _
            DisplayAsIcon:=False, Left:=461.25, Top:=293.25, Width:=190.5, Height _
            :=95.25)
        anOLEObj.Object.Name = "WebBrowser1"
        End If
    ActiveSheet.Shapes("WebBrowser1").OLEFormat.Object.Object.Navigate2 _
        "http://chart.apis.google.com/chart?cht=p3&chd=s:KW&chs=250x100&chl=Hello|World"
    End Sub
The code below adds the functions needed to map numerical data into one of the special codes that Google uses for its charts. For more on the role these functions play see the Google Chart API documentation. Examples of how to use the functions are in the subsequent sections of this document.
Function GoogleChartAPISimpleEncoding(DataToEncode, MaxVal)
    Dim X, Rslt As String
    Const simpleEncoding As String = _
        "ABCDEFGHIJKLMNOPQRSTUVWXYZabcdefghijklmnopqrstuvwxyz0123456789"
    Rslt = "s:"
    For Each X In DataToEncode
        Dim CurrVal As Single
        If TypeOf X Is Range Then
            CurrVal = X.Value
        Else
            CurrVal = X
            End If
        If Not IsNumeric(CurrVal) Then
            Rslt = Rslt & "_"
        ElseIf CurrVal >= 0 And CurrVal <= MaxVal Then
            Rslt = Rslt _
                & Mid(simpleEncoding, _
                    (Len(simpleEncoding) - 1) * CurrVal / MaxVal + 1, 1)
        Else
            Rslt = Rslt & "_"
            End If
        Next X
    GoogleChartAPISimpleEncoding = Rslt
    End Function
Function GoogleChartAPITextEncoding(DataToEncode, MaxVal)
    End Function
Function GoogleChartAPIExtendedEncoding(DataToEncode, MaxVal)
    Const ExtendedEncoding As String = _
        "ABCDEFGHIJKLMNOPQRSTUVWXYZabcdefghijklmnopqrstuvwxyz0123456789-."
    Dim X, Rslt As String
    Rslt = "e:"
    For Each X In DataToEncode
        Dim CurrVal As Single
        If TypeOf X Is Range Then
            CurrVal = X.Value
        Else
            CurrVal = X
            End If
        If Not IsNumeric(CurrVal) Then
            Rslt = Rslt & "__"
        ElseIf CurrVal >= 0 And CurrVal <= MaxVal Then
            CurrVal = Round(CurrVal / MaxVal * 4095, 0)
            Dim Val1, Val2
            Val1 = CurrVal \ 64
            Val2 = CurrVal Mod 64
            Rslt = Rslt & Mid(ExtendedEncoding, Val1 + 1, 1) _
                & Mid(ExtendedEncoding, Val2 + 1, 1)
        Else
            Rslt = Rslt & "__"
            End If
        Next X
    GoogleChartAPIExtendedEncoding = Rslt
    End Function
The code in addCharts below adds four charts to the web browser. The first one is simply the basic chart "Hello World" chart from the Google documentation. The second and fourth charts map data in a VBA array. The third chart uses data in a worksheet range. As mentioned earlier the code initializes the web browser so that the document in it contains a single DIV HTML element with the ID of AllCharts. Then, it delegates to the addAChart procedure the task of adding each of the 4 charts. Finally, it uses the enableEvents procedure to associate each added DIV with a VBA event-enabled variable of type HTMLDivElement.
Note that the 2 module level declarations are needed to persist handling of events inside the HTML document.
Option Explicit
Dim DocEvents As clsWebBrowser, ChartDivs As Collection
Sub addCharts()
    Set DocEvents = New clsWebBrowser
    Set ChartDivs = New Collection
    Set DocEvents.aBrowser = Sheet1.WebBrowser1
    With Sheet1.WebBrowser1
    .Height = 200: .Width = 420
    .Document.body.innerHTML = _
        "<head></head><body><div id='AllCharts'></div></body>"
        End With
    DocEvents.aBrowser_DocumentComplete Nothing, ""
    addAChart Sheet1.WebBrowser1, "cht=p3&chd=s:KW&chs=250x100&chl=Hello|World"
    addAChart Sheet1.WebBrowser1, "cht=lc&chd=" _
        & GoogleChartAPIExtendedEncoding(Array(160, 80, 40, 20, 10, 0), 200) _
        & "&chs=250x100"
    addAChart Sheet1.WebBrowser1, "cht=p3&chd=" _
        & GoogleChartAPISimpleEncoding(Range("H26:H28"), _
            Application.WorksheetFunction.Max(Range("H26:H28").Value)) _
        & "&chs=250x100&chl=Hello|there|World"
    addAChart Sheet1.WebBrowser1, "cht=lc&chd=" _
        & GoogleChartAPIExtendedEncoding(Array(0, 10, 20, 40, 80, 160), 200) _
        & "&chs=250x100"
    enableEvents
    End Sub
The addAChart routine adds a new DIV child in the AllCharts DIV within the WebBrowser document. Then, it inserts an image tag (IMG) in the new DIV and sets the image source to the appropriate URL to generate the chart. Note that the DIV floats in the document and the image element has a small margin.
Sub addAChart(ByVal aBrowser As WebBrowser, ByVal ChartURL As String)
    Dim ID As Integer
    With aBrowser.Document
    ID = .getElementsByTagName("div").Length
    With .getElementById("AllCharts")
    .innerHTML = .innerHTML & "<div id='" & ID _
        & "' style='float:left;background-color:00ffff'><img src='" _
        & "http://chart.apis.google.com/chart?" & ChartURL _
        & "' style='margin:""2px""'/></div>"
        End With
        End With
    End Sub
Finally, to establish event handling, there are two things that must happen. First, the enableEvents routine creates a variable of class clsHTMLDiv, associates each HTML DIV element containing a chart with the "with events" aDiv variable in the class, and persists the variable through the ChartsDiv module level collection variable.
Sub enableEvents()
    Dim I As Integer, aDivObj As clsHTMLDiv, aDiv As HTMLDivElement
    With Sheet1.WebBrowser1.Document
    For I = 1 To .getElementsByTagName("div").Length - 1
        'Skip element zero in the for loop since it should be the "parent" _
         DIV (with ID='AllCharts')
        Set aDivObj = New clsHTMLDiv
        Set aDivObj.aDiv = .getElementById(CStr(I))
        On Error Resume Next
        ChartDivs.Remove CStr(I)
        On Error GoTo 0
        ChartDivs.Add aDivObj, CStr(I)
        Next I
        End With
    End Sub
Second, a WithEvents variable can only exist in a class module. That is delegated to the clsHTMLDiv class described in the next section..
In the current implementation, the code in the aDiv_ondblclick event handler (see the clsHTMLDiv class module below) does nothing more than display a message about the ID of the DIV that triggered the event. However, in a more useful implementation, one could display a userform with the controls required to reconfigure the chart in that particular DIV.
The clsHTMLDiv class module:
Option Explicit
Public WithEvents aDiv As HTMLDivElement
Private Function aDiv_ondblclick() As Boolean
    MsgBox "double click: " & aDiv.ID
    End Function
Since the DIV elements are configured to float inside the web browser window, changing the dimensions of the window cause the charts to automatically move in the window. Below is an example of the browser with the width halved and the height doubled.