| Introduction |
| The basics |
| Applying the basics to a data set in Excel |
| Alternative formulations |
| A VBA function |
| Two dimensional interpolation |
Bill K on Dec 29, 2011:
Your two dimensional interpolation function works great. You obviously put a lot of work into it. Well done.
DaleW on May 19, 2011:
Nicely done, as usual.
There are a few different types of interpolation techniques. One relies on creating a curve of best fit taking into account the entire data set. This is addressed in the topic Trendline Coefficients and Regression Analysis. Another technique uses piecewise linear interpolation. As the name implies it fits a straight line to each consecutive pair of data points and uses the appropriate straight line for interpolation. It is this technique that is discussed in this section. Other techniques rely on smooth curves that pass through all the data points. These typically are Cubic Spline or Bezier curves and are outside the scope of this section.
An example of piecewise linear interpolation:
|
|
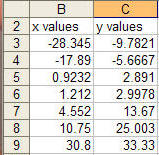
Also, suppose that the ranges containing the X and Y values are named XVals and YVals respectively. If necessary, use Insert | Name > Define... to name cell ranges.
Note that the x values must be sorted in ascending order.
Using linear interpolation, given any two points (x0, y0) and (x1, y1) and the value x2, where x0 ≤ x2 ≤x1 the corresponding y2 value is given by
y2 = y0 + (y1-y0) / (x1-x0) * (x2-x0)
For example, given two data points (x0, y0) = (10.75, 25.003) and (x1, y1) = (30.8, 33.33) the y value that corresponds to the x-value given by x2 = 11 would be
y2 = 25.003 + (33.33 - 25.003) / (30.8 - 10.75) * (11 - 10.75) or y2 = 25.1068
Given any data set (such as the one if Figure 1 above), and a target X value, the first step is to find the 2 X-values that bracket it. These 2 values will correspond to x0 and x1.
Suppose the target X value is given by a cell named TargetVal as in:
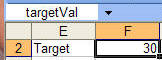
Use the MATCH function to find which x-value corresponds to x0 for this targetVal.
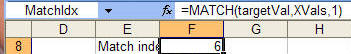
Name the cell containing the formula with the MATCH function as MatchIdx.
This is the index into the XVals range that corresponds to the x0 value. The index for the x1 value, will be one greater than MatchIdx. The actual x0 value is given by INDEX(XVals, MatchIdx) and the x1 value by INDEX(XVals, MatchIdx+1)
The corresponding y values, i.e., y0 and y1, are the same indices applied to the YVals range: INDEX(YVals, MatchIdx) and INDEX(YVals, MatchIdx+1)
Hence, we can now construct the desired result as:
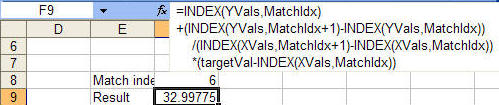
Note this is exactly the same as = y0 + (y1-y0) / (x1-x0) * (x2-x0)
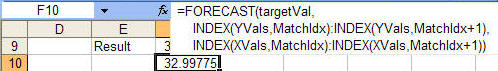
It is possible to simplify the analysis with other built-in Excel functions. The FORECAST function is normally used for interpolation with an entire data set. However, if its arguments are only two data points, its result will be the same as a piecewise linear interpolation.
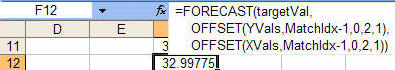
One can also use the OFFSET function to further simplify the formula.
There are instances when a VBA function might be easier to use than worksheet formulas. One instance would be error handling. The above solutions work just fine as long as the target X value is well behaved. Enter a value larger than the largest value in the X range and the result will be #REF! or #DIV/0! Yes, one could expand the formula to trap errors but that would make the formula unwieldy.
An alternative formulation would be a VBA function such as the one below
Option Explicit
Option Compare Text
    Function RealEqual(X, Y) As Boolean
        RealEqual = Abs(X - Y) <= 0.00000001
        End Function
Function LinearInterp(XVals, YVals, TargetVal)
    Dim MatchVal
    On Error GoTo ErrXit
    With Application.WorksheetFunction
    MatchVal = .Match(TargetVal, XVals, 1)
    If MatchVal = XVals.Cells.Count _
            And RealEqual(TargetVal, .Index(XVals, MatchVal)) Then
        LinearInterp = .Index(YVals, MatchVal)
    Else
        LinearInterp = .Index(YVals, MatchVal) _
            + (.Index(YVals, MatchVal + 1) - .Index(YVals, MatchVal)) _
                / (.Index(XVals, MatchVal + 1) _
                    - .Index(XVals, MatchVal)) _
                * (TargetVal - .Index(XVals, MatchVal))
        End If
        End With
    Exit Function
ErrXit:
    With Err
    LinearInterp = .Description & "(Number= " & .Number & ")"
        End With
    End Function
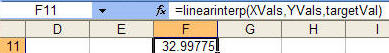
This would be used in a Excel worksheet as:
So far we have looked at interpolation where there is only 1 independent variable (given by x). Now, we look at interpolation with 2 independent variables. In other words, we have some variable z that depends on two independent variables, x and y. This is given by the formula z= f(x,y).
By analogy to the 1D case, interpolation requires that we specify two points (x0, y0, z0) and (x1, y1, z1) and the value (x2, y2) where x0 ≤ x2 ≤ x1 and y0 ≤ y2 ≤ y1. This will let us calculate the corresponding z2 value. The math is not presented here but it is a straightforward extension of the above case. First, calculate two intermediate values based on the known x-values. Then, we use these intermediate values to calculate the result using the known y-values.
| One example of such a
data set is shown in Figure 2-1. In this case, one may want to find the value of the function for say x=0.5 and y= 0.5.
|
|
| Another scenario where interpolation may be required is with missing data. Instead of Figure 2-1 where each (x,y) pair has a corresponding z value, consider Figure 2-2 where not every (x,y) pair has a corresponding z value. |
|
The VBA code below carries out piecewise linear interpolation with two independent variables. There are two functions available for worksheet use.
The first, Interpolate2DArray, applies to the case where one can specify the known x, y, and z values in contiguous ranges. The function itself calculates the required (x0, x1) and (y0, y1) brackets. This corresponds to the data in Figure 2-1.
Interpolate2DArray (Z-values, X-values, Y-values, X2, Y2)
Z-values: Known z-values. A single 2D
range or a 2D array.
X-values: Known x-values. A single 1D range (or 1D
array) with the same number of rows as in Z-values.
Y-values: Known y-values. A single 1D range (or 1D
array) with the same number of columns as in Z-values.
X2, Y2: The function returns the z value corresponding to this
(x,y) pair.
An example of this function is shown below.
The second function, Interpolate2D, requires that the brackets be specified and would be more appropriate for Figure 2-2.
Z-values: Known z-values. Four z values corresponding to
the points (x0,y0), (x0,y1),
(x1,y0), and (x1,y1).
Does not have to be a single range.
X-values: Known x-values. Two values: x0, and
x1. Does not have to be a single range.
Y-values: Known y-values. Two values y0, and
y1. Does not have to be a single range.
X2, Y2: The function returns the z value corresponding to this
(x,y) pair.
The common code required by both functions is at top followed by the two functions themselves.
Option Explicit
Option Base 0
    Function CellAreaDecode(aRng, ByVal I As Long) As Range
        Dim AreaI As Long
        For AreaI = 1 To aRng.Areas.Count
            If I <= aRng.Areas(AreaI).Cells.Count Then
                Set CellAreaDecode = aRng.Areas(AreaI).Cells(I)
                Exit Function
            Else
                I = I - aRng.Areas(AreaI).Cells.Count
                End If
            Next AreaI
        End Function
    Sub MapIn(InVal, ByRef Where)
        Dim I As Integer, HowMany As Integer
        If Not (TypeOf InVal Is Range) Then
            Where = InVal
        ElseIf InVal.Areas.Count = 1 Then
            If InVal.Cells.Count = 1 Then
                Where = InVal.Value
            ElseIf InVal.Columns.Count = 1 Then
                Where = Application.WorksheetFunction.Transpose(InVal.Value)
            Else
                Where = Application.WorksheetFunction.Transpose( _
                    Application.WorksheetFunction.Transpose(InVal.Value))
                End If
        Else
            HowMany = InVal.Cells.Count
            ReDim Where(HowMany - 1)
            For I = 0 To HowMany - 1
                Where(I) = CellAreaDecode(InVal, I + 1).Value
                Next I
            End If
        End Sub
Function Interpolate2D(InF, InX, InY, InX2, InY2)
    'InX contains two values, x0 and x1 _
     InY contains two values, y0 and y1 _
     InF contains 4 values, defined at (x0,y0), (x0,y1), _
                                       (x1,y0), (x1,y1) _
     InX2 and InY2 define the point at which the value of _
     the function is required
    'tests to ensure x0<x2<x1 and 'y0<y2<y1 needed
    Dim F, X, Y, _
        X2 As Double, Y2 As Double
    Dim NoXVals(1)
    MapIn InF, F
    MapIn InX, X
    MapIn InY, Y
    MapIn InX2, X2
    MapIn InY2, Y2
    NoXVals(0) = (F(2) - F(0)) / (X(1) - X(0)) * (X2 - X(0)) + F(0)
    NoXVals(1) = (F(3) - F(1)) / (X(1) - X(0)) * (X2 - X(0)) + F(1)
    Interpolate2D = _
        (NoXVals(1) - NoXVals(0)) / (Y(1) - Y(0)) * (Y2 - Y(0)) _
        + NoXVals(0)
    End Function
Function Interpolate2DArray(InF, InX, InY, InX2, InY2)
    'Arguments should be in the following format.  However, currently _
     there is no validation of the arguments. _
     Each of the arguments can be either a range or an array. _
     InX is a single dimension array of x values sorted ascending. _
     InY is a single dimension array of y values sorted ascending. _
     InF is a 2D array with 1 entry for each (X, Y) pair of values in _
     the InX and InY arrays. _
     InX2 is a single value. _
     InY2 is a single value.
    Dim F, X, Y, _
        X2 As Double, Y2 As Double, _
        XIdx As Long, YIdx As Long
    Dim NoXVals(1)
    MapIn InF, F
    MapIn InX, X
    MapIn InY, Y
    MapIn InX2, X2
    MapIn InY2, Y2
    On Error GoTo ErrXIT
    XIdx = Application.WorksheetFunction.Match(X2, X, 1)
    YIdx = Application.WorksheetFunction.Match(Y2, Y, 1)
    If XIdx = UBound(X) And RealEqual(X2, X(XIdx)) Then
        If YIdx = UBound(Y) And RealEqual(Y2, Y(YIdx)) Then
            Interpolate2DArray = F(XIdx, YIdx)
        Else
            Interpolate2DArray = F(XIdx, YIdx) _
                + (F(XIdx, YIdx + 1) - F(XIdx, YIdx)) _
                    / (Y(YIdx + 1) - Y(YIdx)) * (Y2 - Y(YIdx))
            End If
    ElseIf YIdx = UBound(Y) And RealEqual(Y2, Y(YIdx)) Then
        Interpolate2DArray = F(XIdx, YIdx) _
            + (F(XIdx + 1, YIdx) - F(XIdx, YIdx)) _
                / (X(XIdx + 1) - X(XIdx)) * (X2 - X(XIdx))
    Else
        NoXVals(0) = F(XIdx, YIdx) _
            + (F(XIdx + 1, YIdx) - F(XIdx, YIdx)) _
                / (X(XIdx + 1) - X(XIdx)) * (X2 - X(XIdx))
        NoXVals(1) = F(XIdx, YIdx + 1) _
            + (F(XIdx + 1, YIdx + 1) - F(XIdx, YIdx + 1)) _
                / (X(XIdx + 1) - X(XIdx)) * (X2 - X(XIdx))
        Interpolate2DArray = NoXVals(0) _
            + (NoXVals(1) - NoXVals(0)) _
                / (Y(YIdx + 1) - Y(YIdx)) * (Y2 - Y(YIdx))
        End If
    Exit Function
ErrXIT:
    With Err
    Interpolate2DArray = .Description & "(Number= " & .Number & ")"
        End With
    End Function