Key Features of TM Leader Lines
Using the TM Leader Lines add-in
In many instances where one wants to visualize a fair amount of data, data labels play an important role. When data points are clustered close to each other, the data labels tend to run into each other that can result in an unusable mess. Moving the labels away from the data makes it difficult, if not impossible, to know what label goes with what point. A common technique to resolve this ambiguity is to draw a line from the label to the data point. This is called a leader line. Unfortunately, as anyone who has had to deal with real world instances of connecting data labels to data points knows this task is far from trivial. The TM Leader Line add-in makes it easy to interactively arrange the labels in a visually appealing layout.
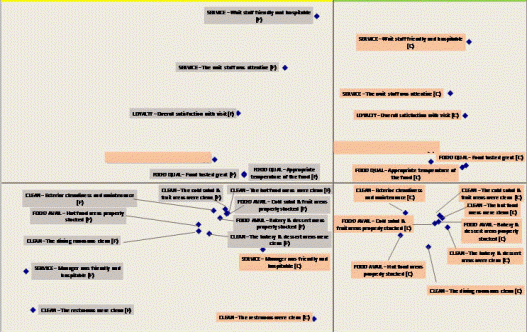
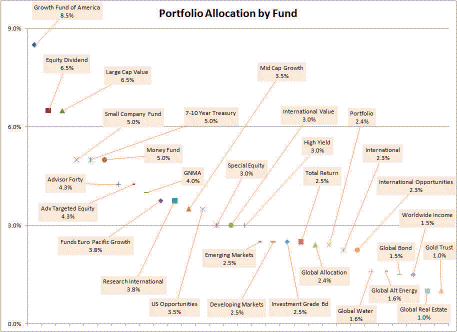
In each of the two examples below, leader lines clarify which label goes with which data point.
The add-in facilitates the management of leader lines for either a specific series in a chart or all the series in a chart. In each case, one can add leader lines, adjust them, remove them, or apply custom formatting to existing leader lines. In addition, the dialog box remains visible while the user makes other changes to the chart. This makes the placement of labels and redrawing of the leader lines in a busy chart extremely easy and highly interactive.
The add-in works with certain types of charts. It works with 2D charts of the following types: XY Scatter, Line, Bubble, Column, and Bar. For Pie charts, use Excel's built in leader line capability. I plan to include additional chart types as and when I can resolve blocking issues with those chart types.
The add-in works with Excel 2007 or later only. This is for technical reasons since Excel 2003 does not provide the information required to draw the leader lines.
Note that the self-installer version also installs an uninstall capability. To uninstall select scroll down to the entry.
If you chose to download the zip version, unzip the add-in file to a directory of your choice.
For installation instructions see common installation instructions.
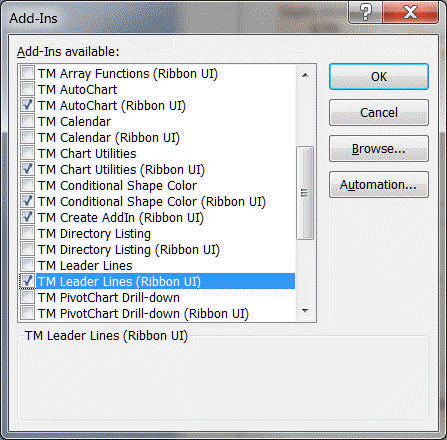
The add-in file is TM Chart Leader Lines.xlam. In Excel 2007, load the TM Chart Leader Lines (Ribbon UI) add-in. This add-in works only with Excel 2007 or later.
Once installed and loaded, the Leader Lines button shows up in the TM tab | Charts group
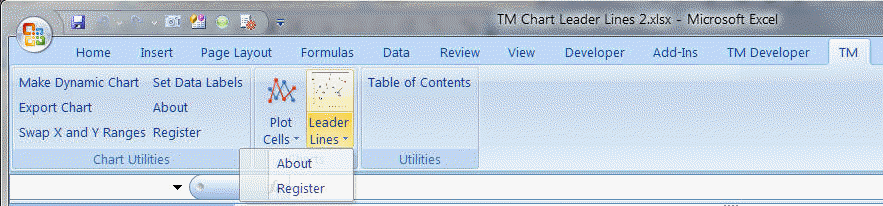
Select the Leader Lines button to bring up the TM Leader Lines dialog box
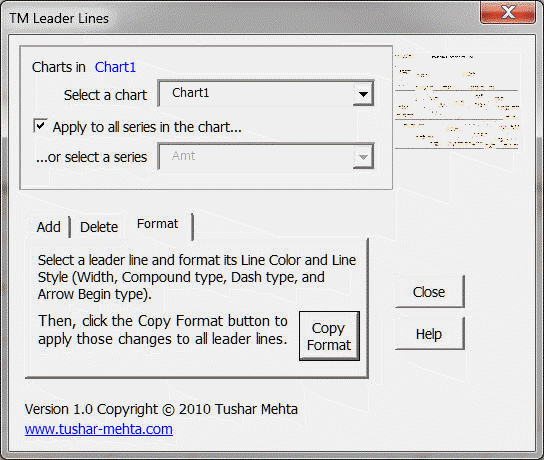
This is an interactive dialog box and changes to the chart will show up as soon as one clicks the appropriate button while the dialog box remains visible. It will go away only when one explicitly dismisses it with the Close button or the X button.
The top part of the dialog box controls what is affected by the decisions made in the lower part of the dialog box.
The first drop down lists all the charts in the current sheet. Changing sheets will result in the choices in the drop down changing. A thumbnail of the currently selected chart is shown to the right of the dropdown.
The checkbox 'Apply to all series in the chart...' controls whether the leader line choices apply to all the series in the chart or only to the series selected in the 2nd drop down (with the label "...or select a series").
There are three tabs in the lower part of the dialog box.
The first labeled 'Add' lets one add leader lines with a degree of customizability.
The second, 'Delete,' lets one delete leader lines previously added by the add-in.
The 3rd tab, labeled 'Format', lets one apply certain custom formatting from one leader line to all of the other lines.
After selecting the chart and optionally a single series in the chart, click the Add tab.
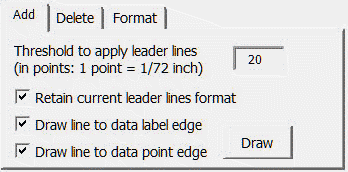
The options include:
The threshold textbox defines how far the label has to be from the point for the add-in to draw a leader line.
The Retain current leader lines format checkbox is an option to retain certain specific format attributes of any existing line. For which attributes are retained see the explanation for the Format tab.
The Draw line to data label edge checkbox controls whether the leader line extends to the center of the data label or stops at the label boundary.
The Draw line to data point edge checkbox controls whether the leader line extends to the center of the data point or stops at the boundary.
Click the Draw button to draw (or redraw) the leader lines.
After selecting the chart and optionally a single series in the chart, click the Delete tab.
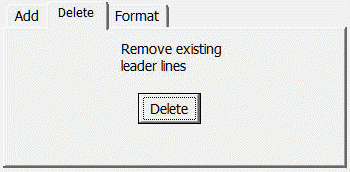
Click to delete the leader lines added by the add-in. This applies to the chart selected in the top part of the dialog box (and optionally only to the selected series).
After selecting the chart and optionally a single series in the chart, click the Format tab.
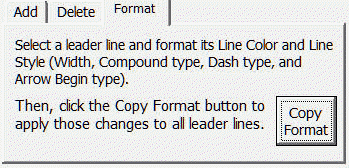
Next, select any existing leader line created by the add-in and format as desired any or all of the attributes indicated in the dialog box. Once done click the Copy Format button and the add-in will apply these format choices to the other leader lines.

