Recently, I received yet another promotion from yet another company offering me money at zero percent interest with the predictable asterisk next to the zero percent. Instead of just shredding the offer I decided to create a downloadable Excel template to analyze the offer, which was an interest-free 18 month loan for a 4% transaction fee with a minimum $10 fee.
Obviously, the transaction fee makes sure that the money is not ‘free.’ So, how does one calculate the cost of the loan? I settled on an “effective interest rate.”
The offer did not make clear whether the repayment could be a single lump sum at the end of the promotion period or if monthly payments were required. So, the analysis addresses both possibilities.
Figure 1 lists some sample loan amounts together with the effective interest rates and the actual transaction fee. For loan amounts below $250, the minimum fee drives the cost of the loan. Consequently, for small loan amounts the effective interest rate is fairly steep. For example a $100 loan with monthly payments costs a whopping 13.6%! Even with a lump sum payment it still costs just over 7%! Once the loan amount crosses $250, the 4% transaction fee determines the actual fee and the effective interest rate is constant at 2.72% with the lump sum repayment and 5.2% with monthly payments. Of course, the actual transaction fee continues to rise as the loan amount increases.
The analysis uses Excel’s Data Table feature: Data tab | Data Tools group | What-If Analysis dropdown | Data Table… button.
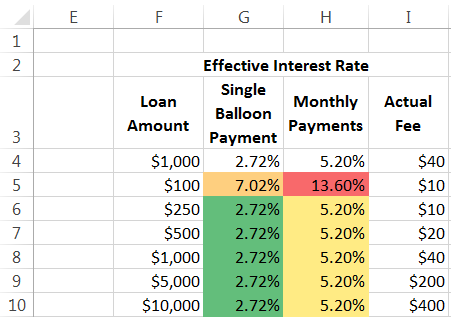
Figure 1
Download the XLSX file, contained in a ZIP file.
Start with the information about the promotion and include some basic calculations as in Figure 2.
[For cells with formulas, the formula is shown in the adjacent column.]
The loan amount, the percent transaction fee, and the minimum fee are in cells B4:B6 respectively. The actual transaction fee and the money actually received from the bank are in B7 and B8 respectively. The loan date and the promotion end dates are in B9:B10 respectively.
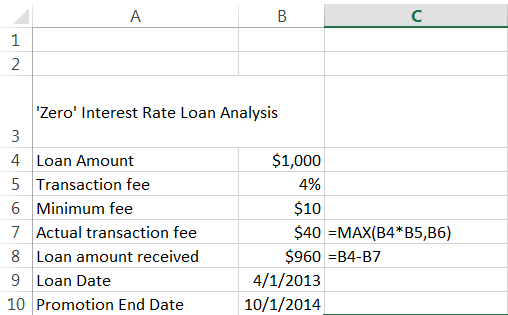
Figure 2
Now, as mentioned above, there are two possibilities. The bank allows a single balloon payment at the end of 18 months or it requires monthly payments. The advantage to the consumer of the balloon payment is that the entire loan amount (less the transaction fee) is available for the entire 18 months. The disadvantage is that one must have the discipline to save up the entire loan amount 18 months by the balloon payment due date.
The single payment analysis uses daily compounding and multiplies the daily rate by 365 to get the annual rate as in Figure 3.
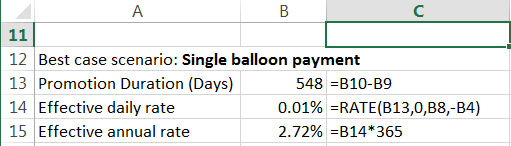
Figure 3
The monthly payment option computes a monthly rate and multiplies it by 12 to get an annual rate. The number of payments calculation uses the DATEDIF function, a long present Excel function that remains mysteriously undocumented. The analysis is in Figure 4.
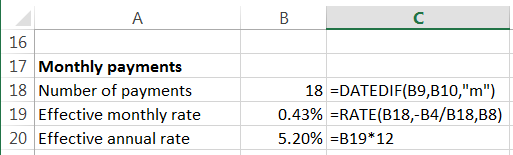
Figure 4
The worksheet is protected with no password. While protected, the only selectable cells are those in which one can enter data. All the other cells contain formulas required for the calculations.

