Microsoft has introduced a new web based capability that extends its Excel Services offering. This new capability provides a limited interactive view of any table in a web page.
An introduction to this service is below. For those interested in additional capabilities and more advanced and useful capabilities see:
For the consumer:
Learn more about Interactive View
Analyze a table in any web page with a dynamic interactive view
For the developer:
Implement the Interactive View feature for 1 table
Implement the Interactive View feature for multiple tables
Improve the formatting and layout of the 'Interactive View' buttons
The best way to learn about Interactive View is probably by experiencing it. Click the 'Excel Interactive View' button below. It will use the content of Table 1, which lists the top medal contenders at the 2012 Olympics as of August 5, 2012. A snapshot of the resulting view is shown in Figure 1. The layout is fairly self-explanatory: select various tabs with the tab icons on the extreme left column. The next pane displays features relevant to the selected tab. In the snapshot it shows the choices for the Filters tab. The main pane shows the view selected from the extreme right pane, which lists a tabular view or various predefined charts. The table view allows sorting by column and, for each column with numeric data, a default data bar.
| Rank | Nation | Gold | Silver | Bronze | Total |
|---|---|---|---|---|---|
| 1 | China (CHN) | 29 | 16 | 14 | 59 |
| 2 | United States (USA) | 27 | 14 | 15 | 56 |
| 3 | Great Britain (GBR) | 16 | 10 | 10 | 36 |
| 4 | South Korea (KOR) | 10 | 4 | 7 | 21 |
| 5 | France (FRA) | 8 | 7 | 9 | 24 |
| 6 | Germany (GER) | 5 | 10 | 6 | 21 |
| 7 | Italy (ITA) | 5 | 5 | 3 | 13 |
| 8 | Kazakhstan (KAZ) | 5 | 0 | 0 | 5 |
| 9 | North Korea (PRK) | 4 | 0 | 1 | 5 |
| 10 | Russia (RUS) | 3 | 16 | 14 | 33 |
Table 1 -- Top medal contenders as of August 5, 2012
(ranked by gold medal count)
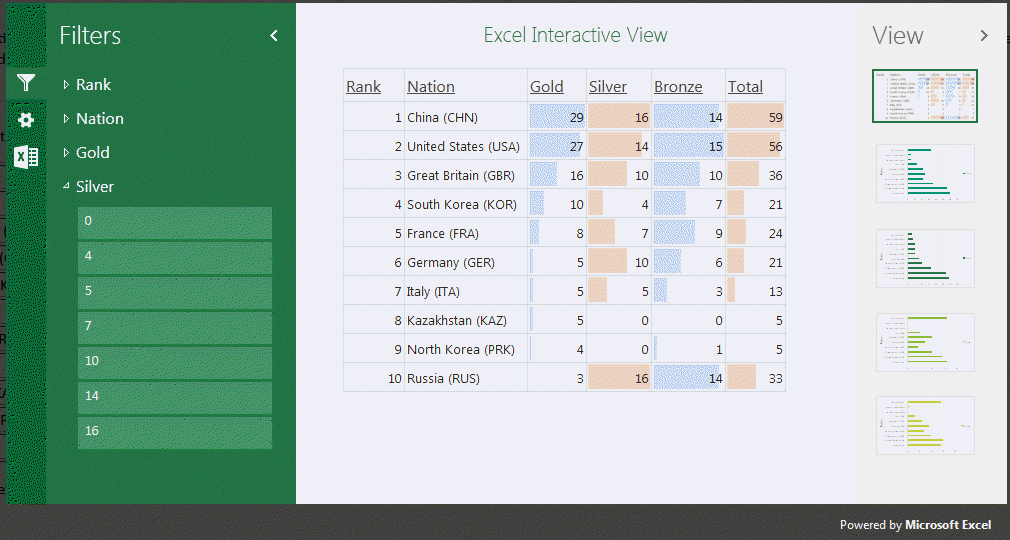
Figure 1 -- Excel Services Interactive View corresponding to Table 1
Figure 2 shows the result of clicking on the chart of gold medal count by country
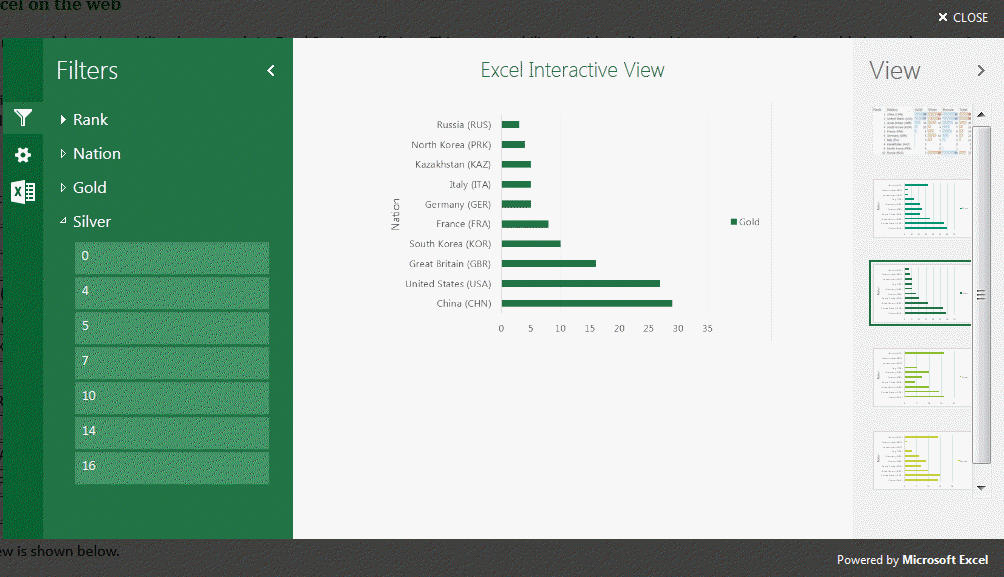
Figure 2
Figure 3 shows the features supported by the Options tab

Figure 3
Figure 4 shows the features supported by the 'Do More' tab.
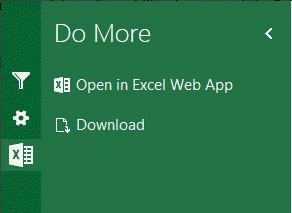
Figure 4
Microsoft has made the Interactive View interface fairly intuitive. However, for those interested in more step-by-step instructions see Debra Dalgleish's tutorial at http://blog.contextures.com/archives/2012/08/02/interactive-excel-sample-data/.
Microsoft's introduction to the Interactive View is at http://www.excelmashup.com/eiv/addbutton.
In all honesty, I consider the current implementation from Microsoft more of a "proof of concept" than a full fledged tool. For starters nothing is customizable: the conditional formatting data bars are what they are, the charts are what they are. For example, it is not possible to see two different columns analyzed in a chart, say, total medal count vs. rank. In other tests I have found that with some data sets (Table 2, for example) Excel Services is unable to figure out what charts might make sense and, consequently, it shows no chart choices (Figure 5)!
Table 2
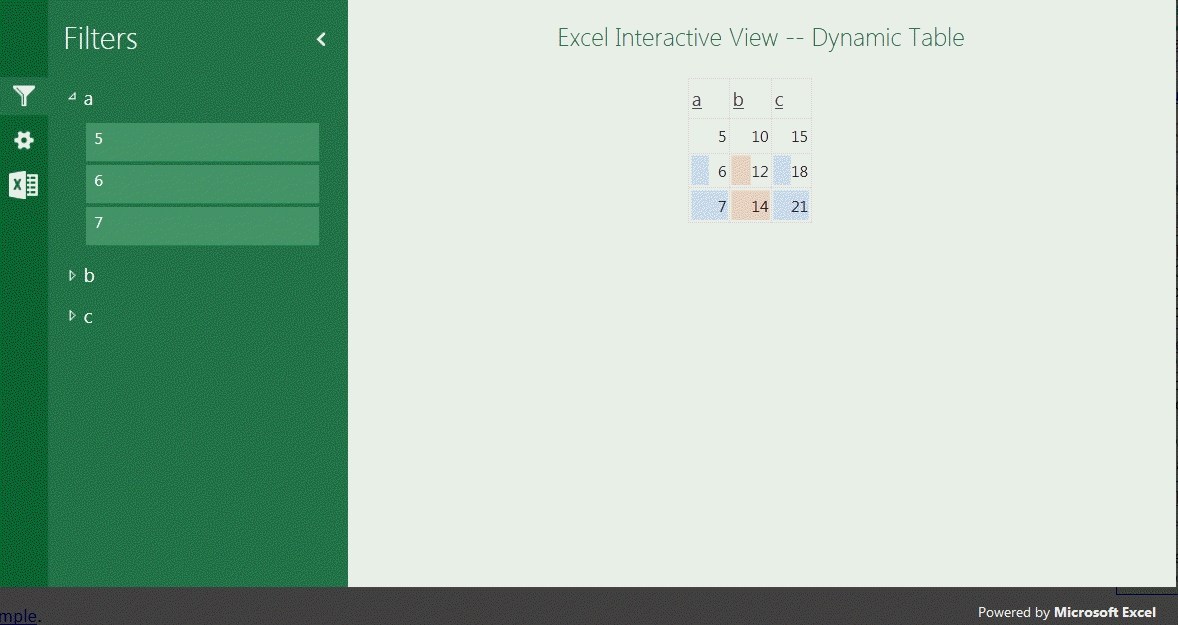
Figure 5

