Excel Services Interactive View introduced Microsoft's new capability of adding interactive view to any table on a web page. Excel Services Interactive View -- Single table showed how to do so with a webpage containing a single table. Excel Services Interactive View -- Multiple tables showed how to handle multiple tables on the same page. Improved Formatting showed how to format the button to improve the web page layout.
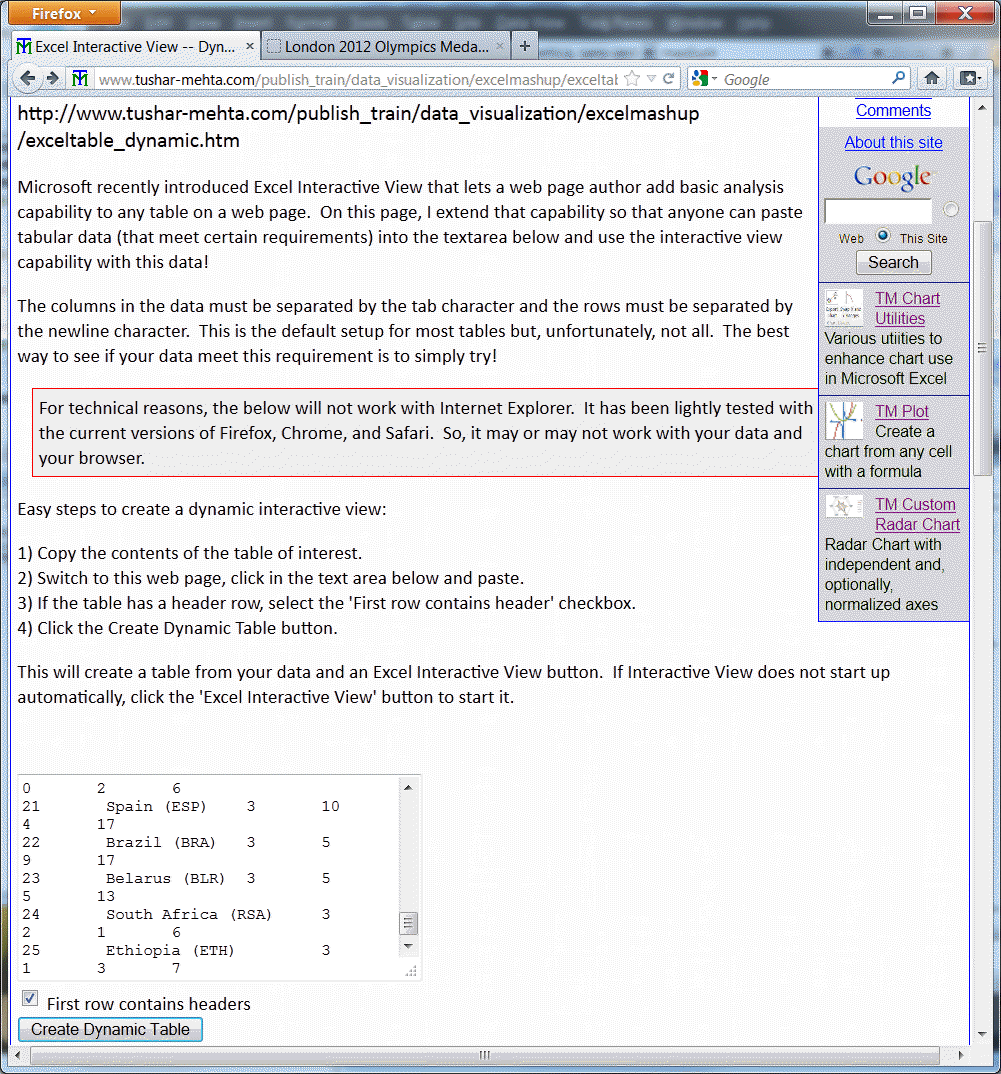
On this page, I extend that capability so that anyone can paste tabular data (that meet certain requirements) into the textarea below and use the interactive view capability with this pasted data!
The table must be created as a proper table. When rows from it are copied, the columns must be separated by the tab character and the rows by the newline character. This is the default setup for most tables but, unfortunately, not all. The best way to see if the table that interests you meets this requirement is to simply try!
For technical reasons, the below will not work with Internet Explorer. It has been lightly tested with the current versions of Firefox, Chrome, and Safari. So, it may or may not work with your data and your browser.
Five easy steps to a dynamic interactive view:
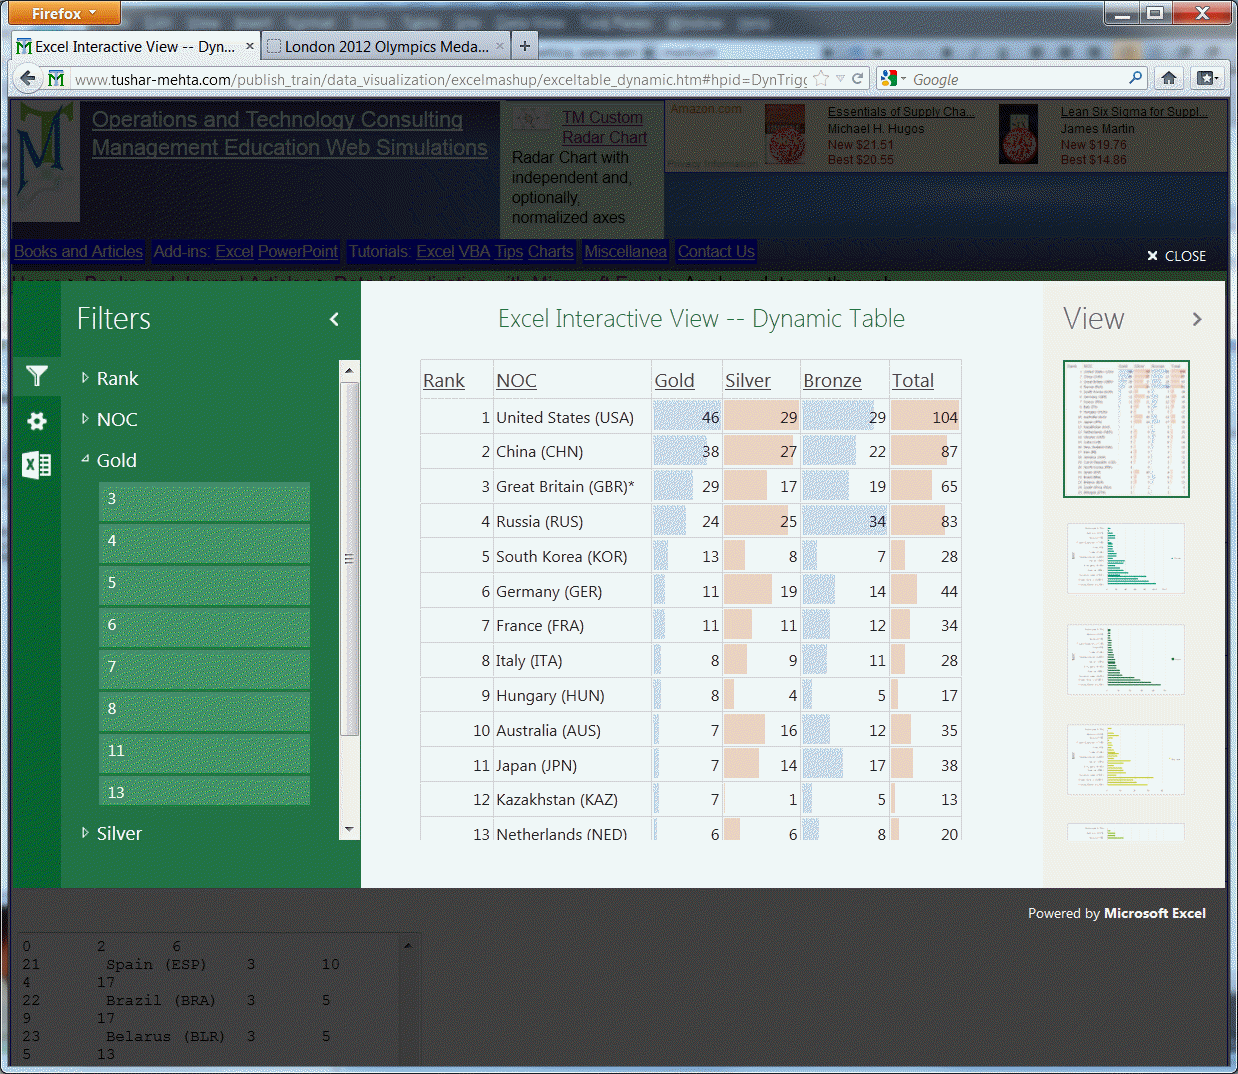
This will create a table from your data and an Excel Interactive View button. If Interactive View does not start up automatically, click the 'Excel Interactive View' button to start it.
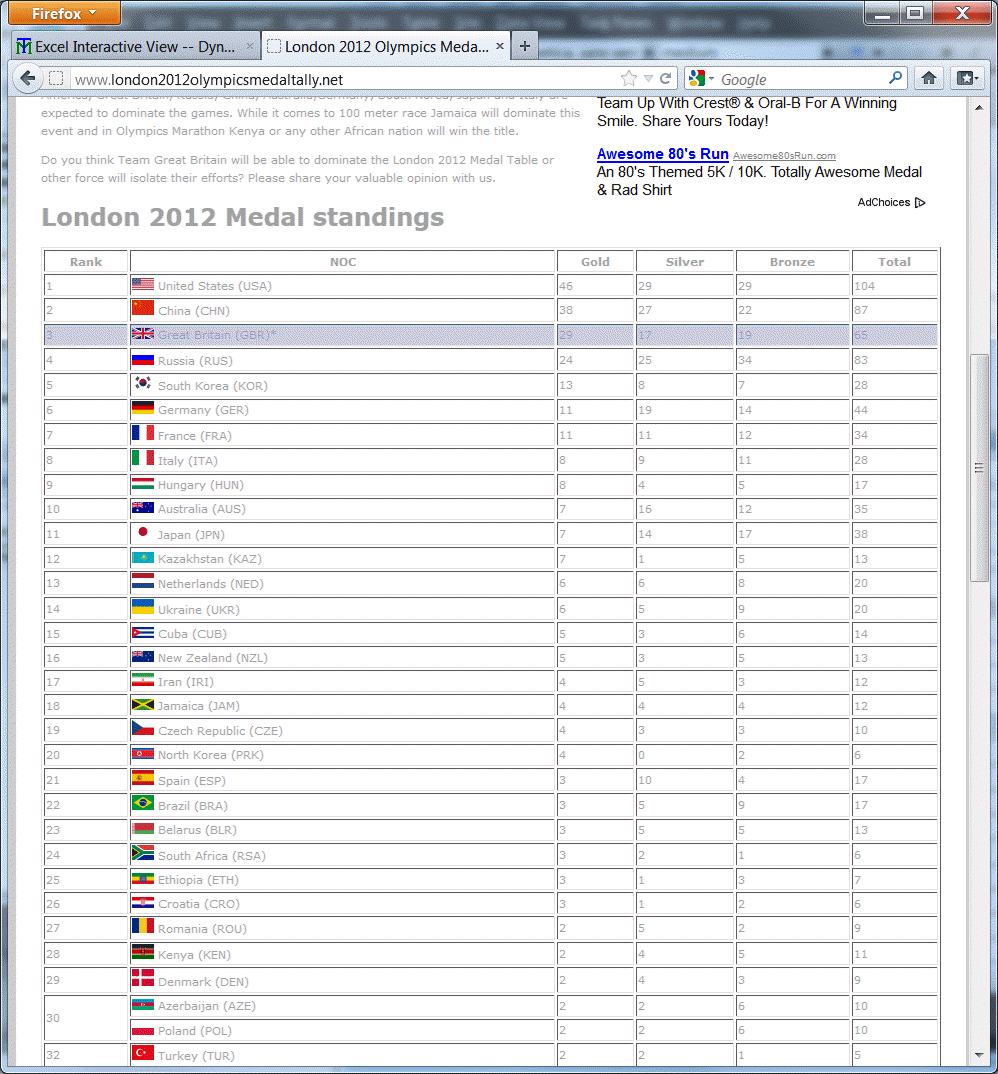
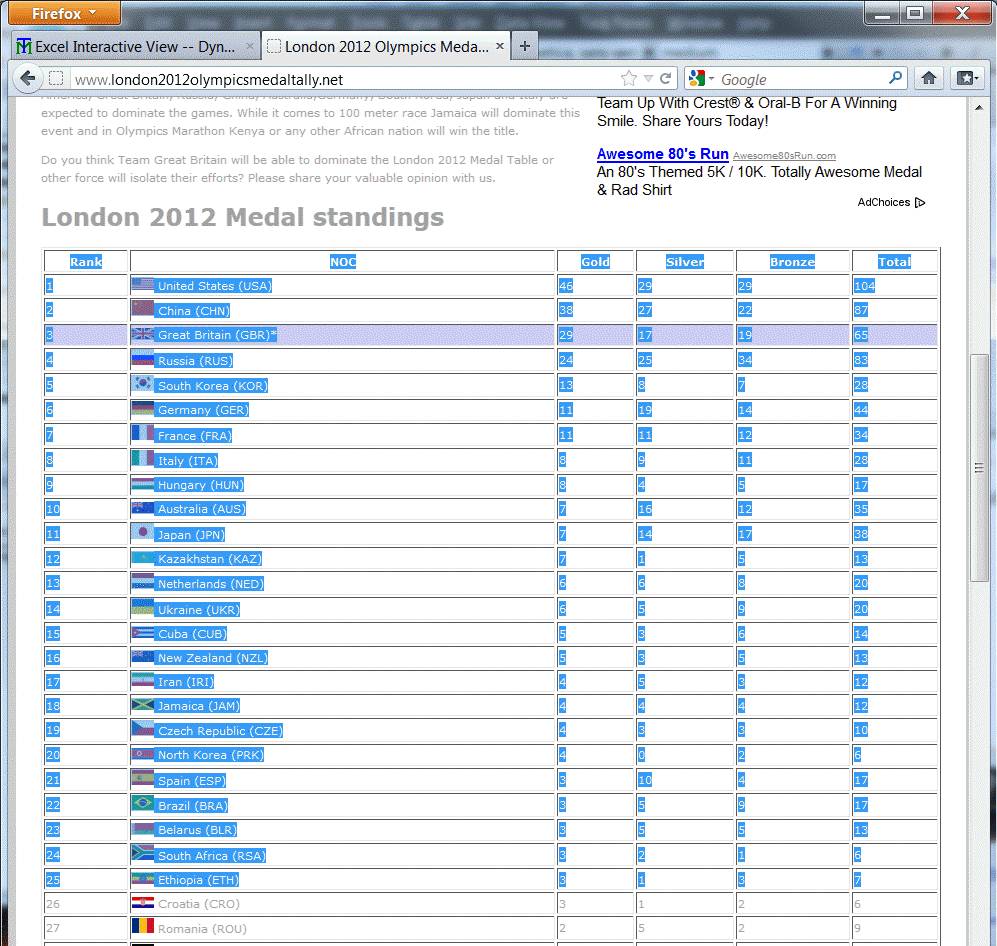
Below is an example of analyzing the 2012 Olympic medal rankings from http://www.london2012olympicsmedaltally.net/.