Keywords: chart image to data
|
Given only an image of a chart, estimate the data associated with it This add-in is designed for those instances when one has an image of a chart but not the underlying data. Once the image is in electronic form, this add-in can help estimate the values of the associated data. If you need help downloading and installing the add-in, read on.
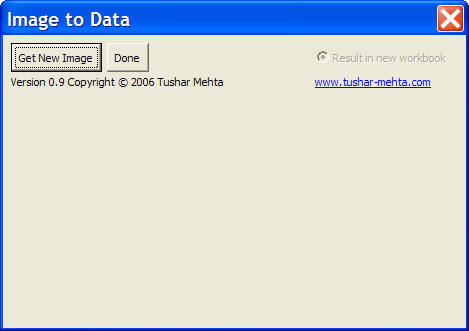
For more details on the installation process, see Common Installation Instructions for Office add-ins Using the add-inUpon selecting TM | Chart Utilities > Data from Chart Image... the default dialog box will show up.
This add-in only works with a chart that has linear axis. That rules out its use with any variant of a log chart or other charts with a non-linear axis. Note that a linear axis is not the same as a linear series. The plotted series can be any kind. It is just the axes that have to be linear. |
|
|
|
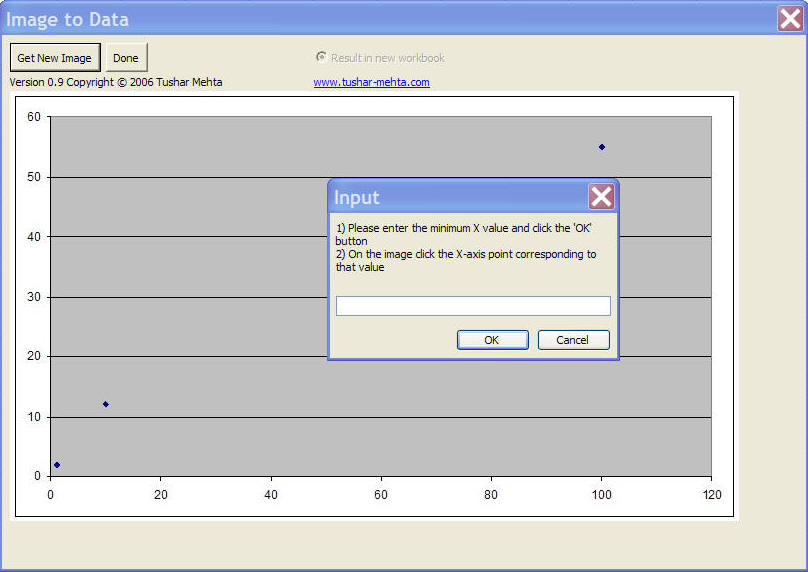
Click the Get New Image button to load a new image of a chart. This will also trigger a calibration process. This will help the add-in track how the various points on the image map on to the actual values of interest. This four step process separately identifies each of the X-minimum, X-maximum, Y-minimum, and Y-maximum values. The image below shows the first point to be calibrated. In the first of four steps, enter the minimum x value (zero in this case) and after the Input dialog box closes click on the x-axis location that corresponds to this value. The next 3 steps in the calibration process identify the other three critical locations.
Once all four points are calibrated, click on the form to get the corresponding (X, Y) values. The results will be in a new workbook. |
||