There are instances when there are data series plotted on both the primary and secondary axes. For example, suppose we want to plot the two series A and B in Figure 1, with the elements in column B as the x-axis values. The A series will be a column cart on the primary axis and the B series will be a line chart on the secondary axis.
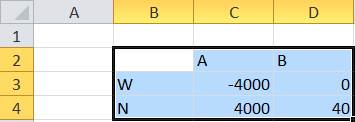
Figure 1
Figure 2 shows the default result. It’s easy to misinterpret the chart since the negative value of the A series W point appears above than the zero value of the B series W point!
Figure 2
One way to improve the display is to align the zero values
on the primary and secondary axes. The easiest way to do this is to ensure
that the 2 axes have the same ratio of the maximum value to the minimum value.
In the example for the primary axis we get  = 4000/-4000 = -1.
This is our goal for the secondary axis. At the same time, we have to ensure the actual minimum and maximum axis values do justice to the data. For example, we cannot pick -4000 and +4000 or -4 and +4! In this example, we can try an easy fix. Set the minimum value to -45 as in Figure 3.
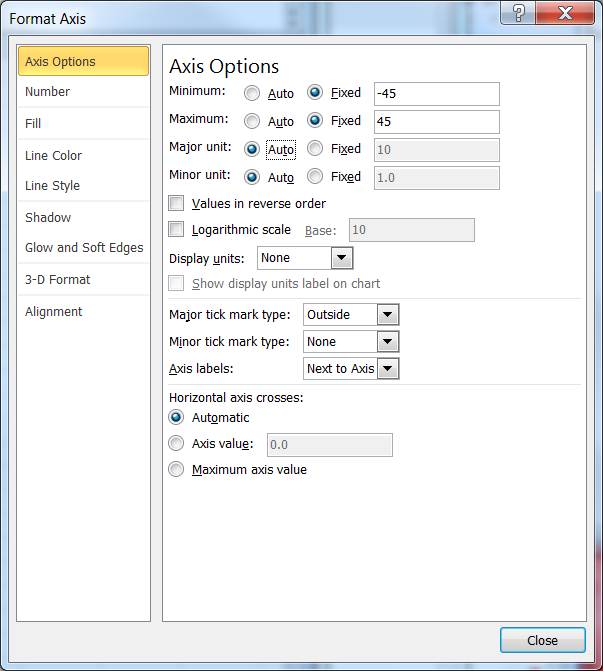
Figure 3
The result is as in Figure 4. This leads to the next important consideration, which is that the primary and secondary tick marks are now misaligned. The horizontal gridlines are aligned with the primary axis tick marks. On the other hand, the secondary axis tick marks are not aligned with the gridlines. In addition, we don’t actually see the zero value on the secondary axis!

Figure 4
The reason is that the ratio of the axis range to the value of the major unit is now different. For the primary axis, the ratio is 10,000/1,000 or 10, while for the secondary axis it is 90/5 or 18. We could adjust the major unit for the secondary axis to be 9 (the resulting ratio would be 90/9) as in Figure 5. But, measuring by 9s is not something that comes naturally to most people.
Figure 5
To maintain a ratio of 10 and a major unit of 10 would require that the range of the secondary axis be 100. So, we could use a minimum value of -50 and a maximum value of +50 as in Figure 6.
Figure 6
A word of caution: Real life data might require some more analysis before the axes line up as in our example. The process of aligning the axes combines science and art.

