Home > Office Marketplace Landing > TM PivotChart Drilldown
Works with Excel 2010 (32-bit and 64-bit), Excel 2007, and Excel 2003
 Dashboards are a popular and convenient way to
visually examine data. However, if a chart
displays something that warrants further investigation,
there is no way to do so from the chart itself.
To "drill down" to the underlying data one
must go back to the originaldata and analyze the relevant subset.
Alternatively, one can delegate the task to a
subordinate and have her/him do the work.
Dashboards are a popular and convenient way to
visually examine data. However, if a chart
displays something that warrants further investigation,
there is no way to do so from the chart itself.
To "drill down" to the underlying data one
must go back to the originaldata and analyze the relevant subset.
Alternatively, one can delegate the task to a
subordinate and have her/him do the work.
The TM PivotChart Drilldown feature of the add-in supports a single-click drill down capability. Click on a PivotChart's data point and the add-in will show the details of the underlying data in the same chart. Each click drills down to the next more detailed level and a click on the lowest (most detailed) level returns the chart to the summary view.
The example below shows a PivotChart reporting on the number of annual scans of different types performed by each technologist at a radiology department with two locations (the 2011 data are projected scan volume). The PivotTable corresponding to the PivotChart has 4 row fields (Year, Location, Modality, and Technologist) and 1 data field (Sum of Scan).
This example uses a pie chart but the software works with any PivotChart.
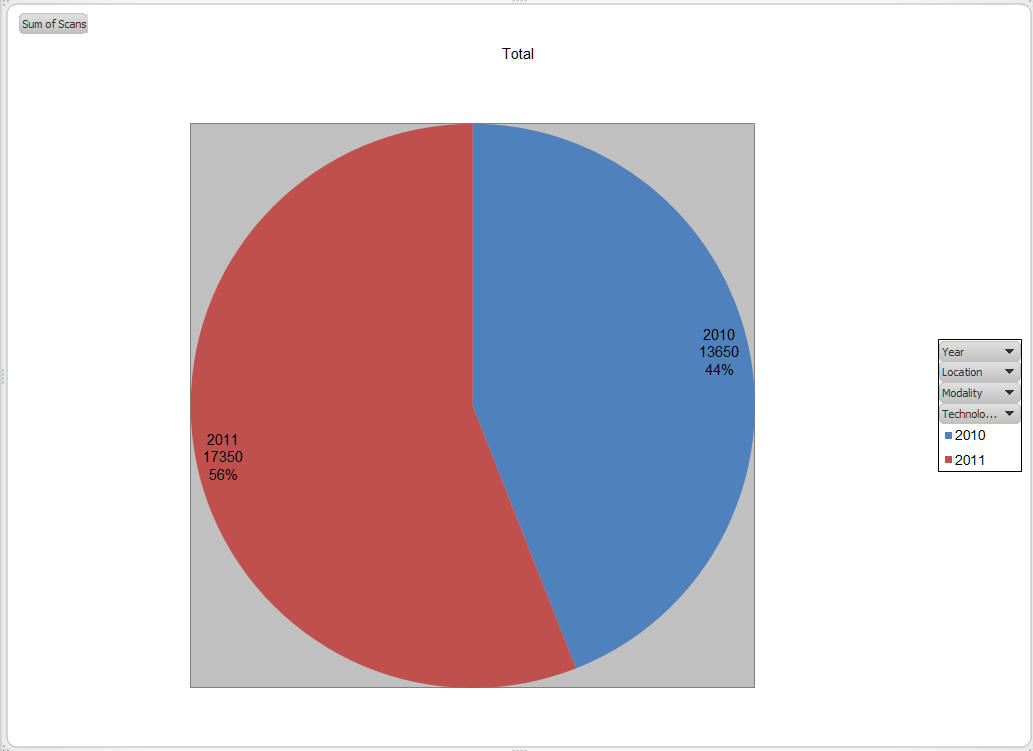
Then, with the TM PivotChart Drilldown feature
enabled, the "highest level" PivotChart will show a summary for the 2 years, 2010
and 2011.
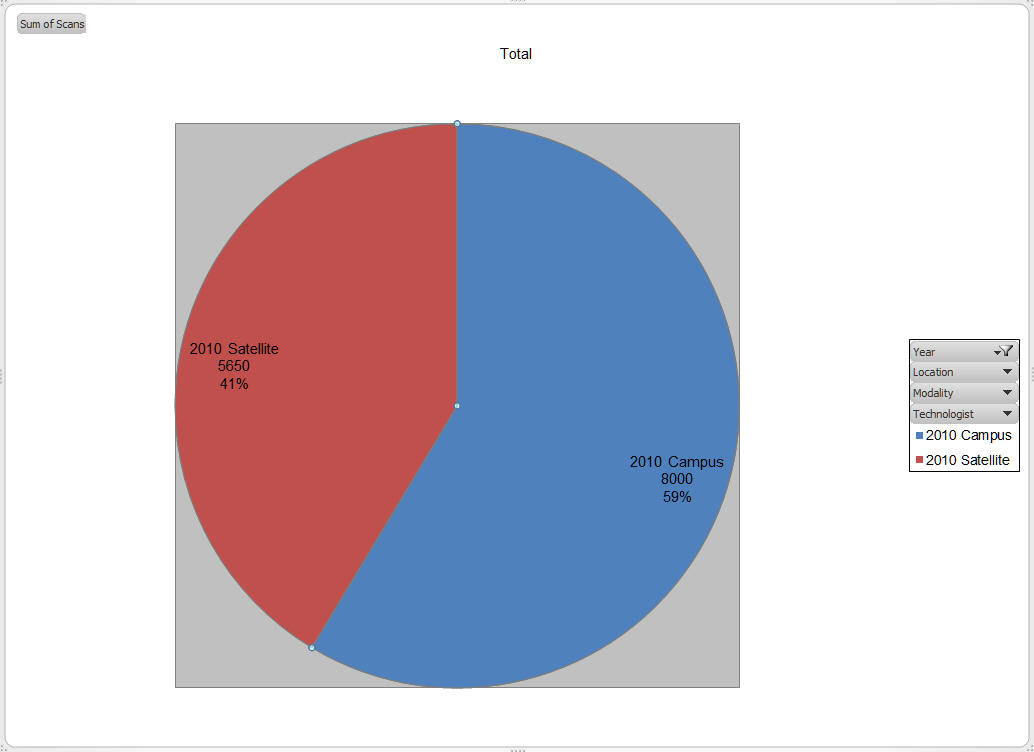
Click on the 2010 point to see the underlying data for the two
locations where services were available in 2010: Campus and Satellite.
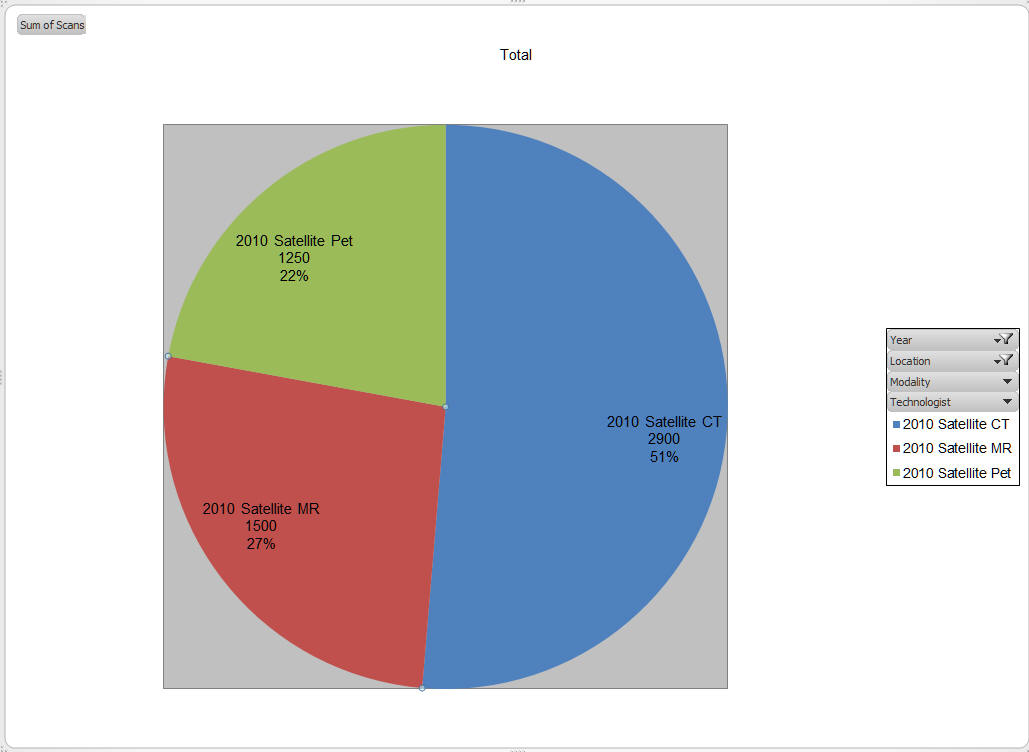
Click on the Satellite data point to see the data for the 3
modalities supported at that site in 2010: MRI, CT, and PET scans.
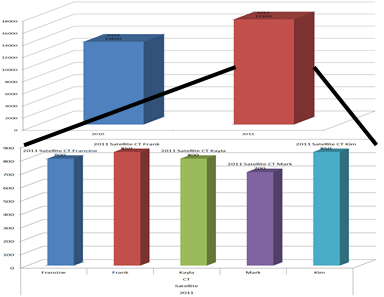
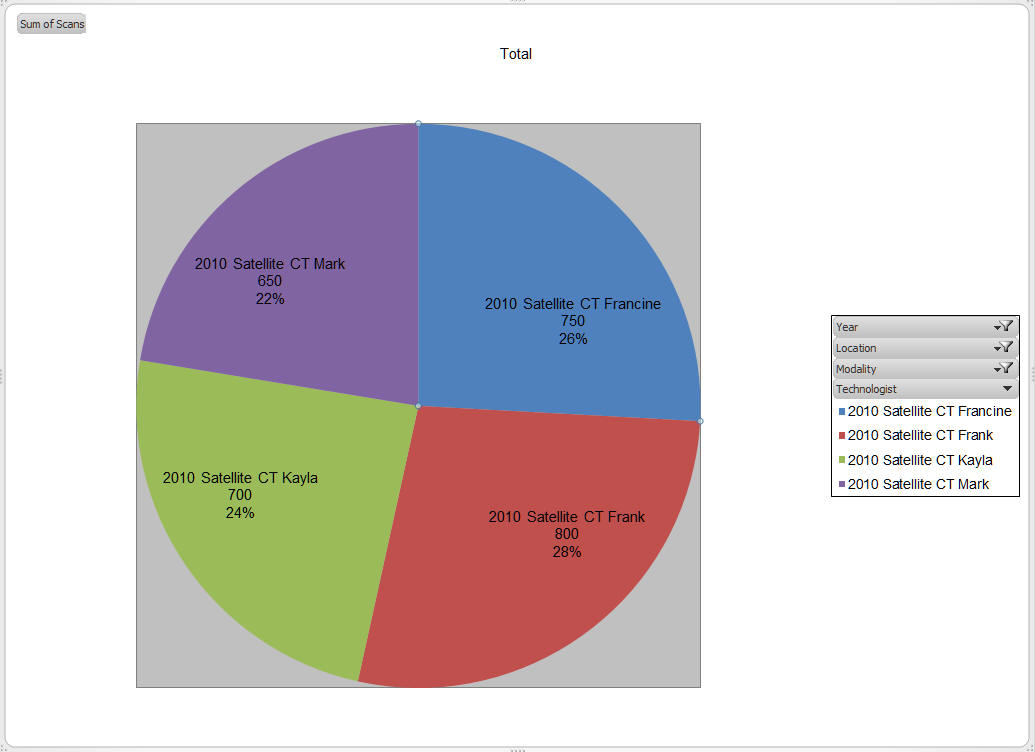
A click on the CT data point shows the number of CT scans by each technologist at the Satellite location for the year 2010. This is the
most detailed level of data in the PivotChart (and the corresponding
PivotTable).
Finally, a click on any of the data points returns the chart to the
highest level, i.e., the year-by-year summary.
Please check the help file, the documentation, and the webpage for the product, template, or service you are interested in first. If you still need help, please email web-underscore-contact-at-sign-tushar-hyphen-mehta-dot-cee-oh-em.
Microsoft has recognized my technical excellence, contributions to various communities, and independent expertise with the Most Valuable Professional (MVP) for Excel annual award for ten years in a row from 2000 to the present.
Please contact me for world-class solutions that integrate the most appropriate business practices and technology to resolve your problem. You can email me at web-underscore-contact-at-sign-tushar-hyphen-mehta-dot-cee-oh-em.
To return to the Microsoft® Office Marketplace from this page, click the BACK button.
To return to this page from any link on the page, just close that window
Unless noted otherwise none of the products downloadable from this website is endorsed by, supported by, or produced by the Microsoft® Corporation.
Microsoft and the Office logo are trademarks or registered trademarks of Microsoft Corporation in the United States and/or other countries.

