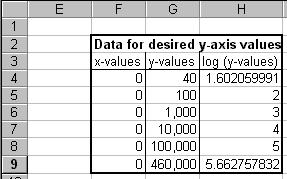
The data set for the pseudo axis is in Figure 6. Once again, remember to create the log of the y-values as in Column H.
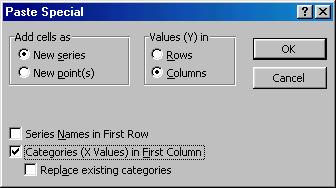
Create a new series with this data set – using the x-values and the log (y-values). Select the chart and follow the steps in Figure 7 through Figure 9.
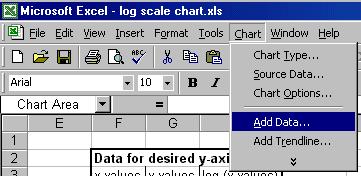
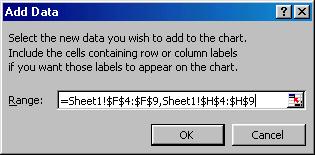
Figure 8