Remove the gridlines (select the chart and then the menu item Chart | Chart Options… | Gridlines tab).
Format the plot area to remove the border and the background (select the Plot Area and then the menu item Format | Selected Plot Area…).
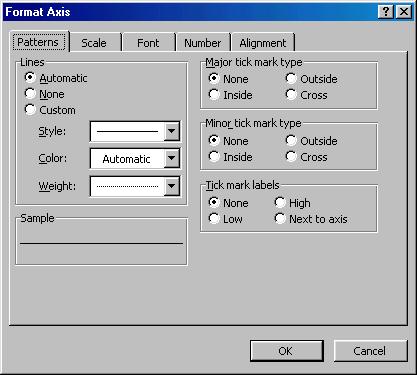
Finally, remove the tick marks and the values shown on the y-axis (click on the y-axis and then select the menu item Format | Selected Axis… | Patterns tab. The last format change is shown in Figure 4.
The result should look like Figure 5.