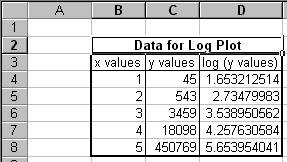
The requirement is to plot the data shown in columns B and C of Figure 1. The graph should use a logarithmic scale for the y-axis, with a minimum value of 40, a maximum value of 460,000. In addition, the graph should contain grid lines at those two values of y, as well as at y = 100, y = 1,000, y = 10,000, and y = 100,000. The resulting graph should look like Figure 2.